
The Impact Factor is Big Business
Aside from the infamous H-Index (which “quantifies” researchers), the most widely known concept from scientometrics is the Impact Factor (IF), which “quantifies” journals. Currently owned by Clarivate, the Journal Impact FactorTM is both a brand and a big business. Many copycats have tried to compete with the IF, but none has ever gained comparable reach. Clarivate’s IF values for individual journals can be retrieved from their Journal Citation Report (JCR), which is published annually.[1] These impact factors are widely used for a number of purposes. For example, university rankings most likely spend substantial sums of money to use IF data.[2] In addition, many scientific journals advertise themselves using impact factors.
Comparisons: Where do you stand?
Simplistically put, Impact Factors relate the number of citations a journal receives to the number of published articles in that journal, all limited to a certain time frame. For example, Impact Factor 1 means on average each article received 1 citation, Impact Factor 10 means on average each article received 10 citations, and so on. As they are plain numbers, the IFs of two journals can easily be used for comparisons. If, however, one wants to know where an individual journal stands with respect to the highest or lowest IF journals, it is crucial to know about the typical range and the distribution of impact factors in the respective scientific field. What is considered a high value? How many high IFs exist in comparison to the low ones? For the sake of this text, we look at them as a simple collection of numbers and try to learn more about how these numbers behave in bulk.
The Percentile Distribution of IF values
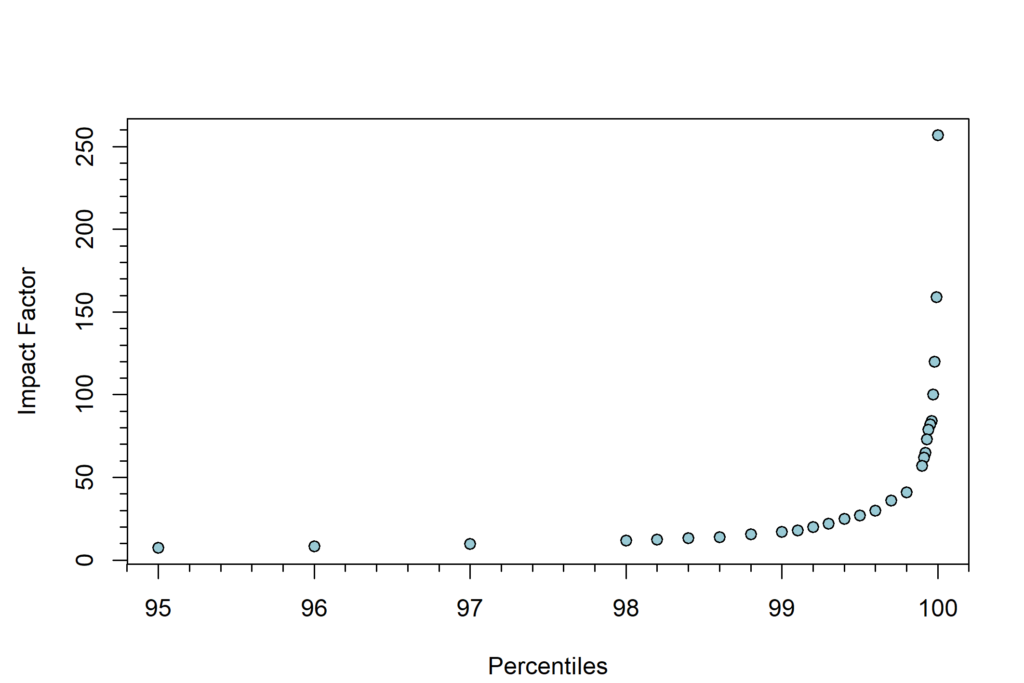
There are currently 21,762 journal titles listed in JCR, 21,699 of which have an IF.[3] The scatterplot below visualizes the range of values for the impact factors as a function of the respective percentiles. It is obvious that this is an extremely skewed distribution. Up to the 95th percentile, meaning for 95% of all the journals in the index, the values are small and in the single-digit range. Whether the increase for the lower values is linear or curved cannot be determined from this plot. The values for the top 5% show a drastic increase in impact factor. A higher density of points was used in that area to better illustrate the curvature.

The Majority
For the sake of clarity, we zoom in to get a clearer picture. Let us first have a closer look at the flat-looking part, the percentiles up to and including the 95th. These are more than 20,000 journals, and they have impact factors of up to 7.4. With the enlarged plot, it becomes evident that the trend is not linear: Higher percentiles have a disproportionately higher IF. The median value is situated at 1.6 – meaning half the journals have a lower IF and half the journals a higher one. At the same time, because the median lies in the flat part, many journals in both directions from the median will share the same value.
On the low end of the spectrum, the bottom 5% have an IF of 0.1 and smaller. Let’s see, what percentage of the journals in the ranking one can overtake by moving up the IF ladder. A journal increasing its IF from 0.1 to 1 will overtake more than 30% of the other journals. Moving up another rung to an IF of 2, at least 25% more will be left behind, and by thus crossing the median, the journal ranks higher than more than half the journals. Going to an IF equal to 3, an additional 15% of journals will be passed. And finally, by stepping up to 4, approximately a further 9% will be surpassed, meaning that a cumulative proportion of around 84% of the journals have an impact factor below 4.

The Upper Echelon
In the next plot, we focus on the top 5% of IF values. Again, at the lower end, the trend looks “flat”, but as was shown before, this is due to the scale, which is much larger than in the previous graph. Less than 3% of the journals in the Journal Citation Report have a double-digit impact factor – any IF above 10 can clearly be considered high. It is also notable that at percentile 99, the increase in between points gets larger. This top 1% of journals comprises 217 titles, and they all have an IF of 17.1 or above. At the 99.9th percentile, the IF values seem to take off exponentially. Some of these points are oddly bunched together, which is a consequence of them representing only 22 journals that are not evenly distributed over the space between IF 57 to IF 257.
Gut feeling compared to actual ranking: A self-experiment:
Before this analysis, I had performed a little human experiment (N = 1) and attempted to name a few journals that I thought had very high impact factors. I would not have been able to provide any answer at all if I had to name a journal around the median area of the distribution. Four titles immediately came to my mind: Lancet, New England Journal of Medicine, Nature, and Science. A look at the 2022 impact factors [3], tells me all of these are indeed in the top 1% of the ranking. The titles I listed occupy ranks 2, 3, 18, and 22, respectively. And their rounded impact factors 169, 159, 65, and 57.
| Journal Title | Impact Factor | Rank |
| Lancet | 169 | 2 |
| New England Journal of Medicine | 159 | 3 |
| Nature | 65 | 18 |
| Science | 57 | 22 |
Currently on rank 1 resides CA: A Cancer Journal for Clinicians with an IF of 257. I should have remembered this title, as I mentioned it in my previous blog post on Acta Crystallographica Section A. It ranked number one back then in 2009 and 2010, but in fact, it has been ranking number one for the last 18 years.
Conclusion
As plain numbers, Impact Factors are obvious go-tos for comparisons of journals. This is still the case almost eleven years after the San Francisco Declaration on Research Assessment.[4] One point that must be emphasized again and again: The lower 85% of journals span a range of impact factor values of only 4 units. Most journals are situated in a relatively flat area of the impact factor distribution, and because of this flatness, a small change in IF of 0.1 may correspond to a jump of dozens, if not hundreds of places in the absolute ranking. Therefore, journals ranking in this range may very well be subject to large fluctuations and the numbers less meaningful than in the top 5 percent of the distribution. In addition, many journal in these 85% are important society journals and can be considered workhorses in their respective fields. Clearly, considering them bad journals because of their IF is not a valid conclusion.
The top end of the IF distribution contains from 1–3% of the indexed journals. Journals in this part of the distribution have a much larger range of impact factors, making the index more amenable to comparisons. On the other hand, many of these journals are either review journals summarizing what came before or they are focused on a broader audience and thus have a higher reach. The discrepancy between the many and the few could also be likened to visibility of people in large organizations: Some executives deliver excellent work – others are simply excellent at being loud and present. In contrast, many workers at the lower levels of the hierarchy will simply be overlooked, despite their key contributions.
But talking again about journals; once a journal has reached the top 3%, it likely benefits from a Matthew effect of increased desirability that helps it to maintain this status: “For whoever has will be given more, and they will have an abundance. Whoever does not have, even what they have, will be taken from them.”[5] Amen!
In part 3, we will investigate different ways of playing the impact factor game.
[1] https://jcr.clarivate.com/.
[2] The recently released 2023 CWTS Leiden Ranking Open Edition surely is a laudable exception, as it is based on open data from openAlex.
[3] Data was retrieved for the year 2022 from Journal Citation Reports, version Oct 18 2023 of the dataset (Table with excerpt of data)
[4] https://sfdora.org/
[5] Matthew 25:29
[6] Dr. Gina Cannarozzi, Andrej Kilian, Julia Ecker and Dr. Jozica Dolenc are gratefully acknowledged for their assistance in revising this text.